This blog post is part 3 in the series “Tips & Tricks for better log analysis with Kibana”. The other parts can be found here Part 1 and here Part 2.
This blog post is the last in a series on how to make working with your logs easier and better. The first one explained why it’s important to define types for your fields in order to have data that is actually usable. The second one described two approaches for dealing with previously unknown fields to reduce the risk of data loss. In this blog post I will show you how you can improve performance and usability by using custom analyzers and preprocessors.
Use custom analyzers for better usability
Remember our developer from the previous blog posts? She was working on an application generating access logs, which look like the ones in the logs sample dataset that comes with Kibana. One entry looks like this:
{
	"referer": "http://twitter.com/success/patrick-forrester",
	"clientip": "153.196.107.153",
	"response": "200",
	"message": "153.196.107.153 - - [2018-08-01T19:44:40.388Z] \"GET /beats/metricbeat/metricbeat-6.3.2-amd64.deb HTTP/1.1\" 200 6329 \"-\" \"Mozilla/5.0 (X11; Linux i686) AppleWebKit/534.24 (KHTML, like Gecko) Chrome/11.0.696.50 Safari/534.24\"",
	"request": "/beats/metricbeat/metricbeat-6.3.2-amd64.deb",
	"extension": "deb",
	"url": "https://artifacts.elastic.co/downloads/beats/metricbeat/metricbeat-6.3.2-amd64.deb",
	"memory": null,
	"host": "artifacts.elastic.co",
	"utc_time": "2018-08-01T19:44:40.388Z",
	"agent": "Mozilla/5.0 (X11; Linux i686) AppleWebKit/534.24 (KHTML, like Gecko) Chrome/11.0.696.50 Safari/534.24",
	"ip": "153.196.107.153",
	"bytes": 6329,
	"timestamp": "2019-03-27T19:44:40.388Z"
  }
Imagine that a new bug comes in for this application, making it necessary to search through all log entries that belong to requests starting with /beats/metricbeat.
Let’s assume we indexed this data in the request field as standard full-text value:
"request": {
"type": "text"
}
Searching for request:"/beats/metricbeat" results in some matching entries, but it also returns additional entries that we don’t want:
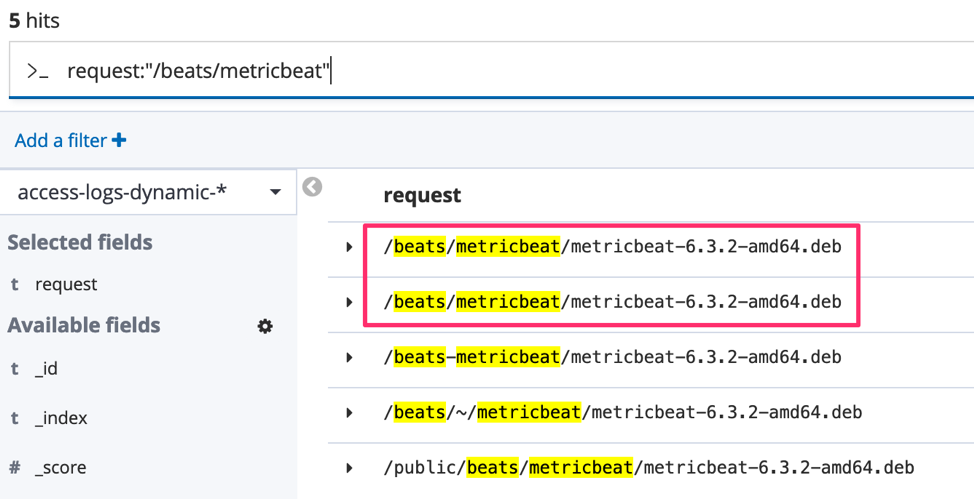
Why are those entries returned? Because of how the data is analyzed.
Analysis is the process of converting text, like the body of any email, into tokens or terms which are added to the inverted index for searching. Analysis is performed by an analyzer. ( source )
The default analyzer is the standard analyzer. You can test its behavior by calling the analyze API with the analyzer name and the text to analyze.
POST _analyze
{
  "analyzer": "standard",
  "text": 	"/beats/metricbeat/metricbeat-6.3.2-amd64.deb"
}
The resulting terms are "beats", "metricbeat", "metricbeat", "6.3.2", "amd64", "deb". The exact same terms are created for /beats-metricbeat/metricbeat-6.3.2-amd64.deb and/beats/~/metricbeat/metricbeat-6.3.2-amd64.deb because the standard analyzer removes (amongst other things) - and / and ~. This explains why these two values were returned by the search in our example.
The last entry (/public/beats/metricbeat/metricbeat-6.3.2-amd64.deb) is returned because the query doesn’t specify that the text must appear at the beginning.
One option to fix both issues is to index the field as a keyword instead of a text. This will a) not strip out any characters and b) allow you to use the prefix query so that you only get entries that start with the expected value. Additionally, it is much more performant than the previous query.
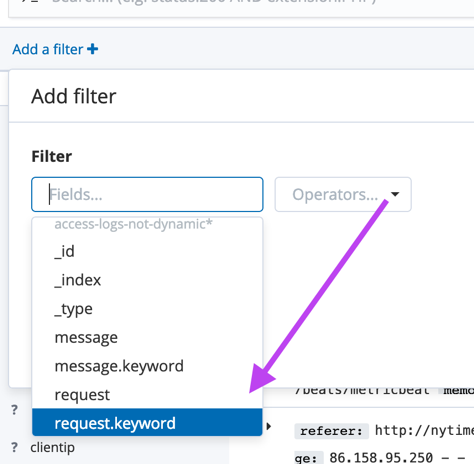
If you still want to perform a full-text search on those fields, consider adding the keyword as a multi-field:
"request": {
"type": "text",
"fields": {
    "keyword": {
          		"type": "keyword"
    }
      }
}
Now you can choose between request and request.keyword for your searches on the request field:
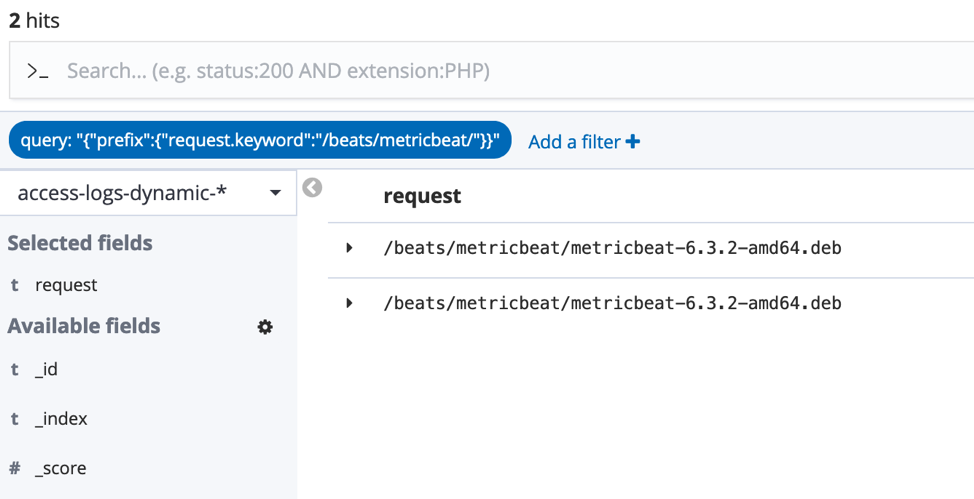
And using the new multi-field in a prefix query, the expected results are returned:
{
  "query": {
	"prefix": {
  		"request.keyword": "/beats/metricbeat/"
	}
  }
}
The downside of this approach is that people have to remember the query syntax. This is fine if it’s for a one-time use case. But if it’s for something that happens on a regular basis, it might be worth improving the mapping to make it easier for everyone. One way to achieve this is to use a custom analyzer.
In our example, it would be useful if you could just enter the prefix of the request (like with the text mapping) and get all matching results (like with the keyword mapping).
This can be achieved by using the path hierarchy tokenizer. Applying it to
/beats/metricbeat/metricbeat-6.3.2-amd64.deb
results in the following terms:
/beats
/beats/metricbeat
/beats/metricbeat/metricbeat-6.3.2-amd64.deb
The relevant section from the index template looks like this:
"settings": {
    "index": {
    "analysis": {
        "analyzer": {
            "path_analyzer": {
                "tokenizer": "path_hierarchy"
          		}
        	}
      	}
    }
}
...
"mapping": {
"properties": {
	...
    "request": {
        "type": "text",
              "search_analyzer": "keyword",
              "analyzer": "path_analyzer",
              "fields": {
            "keyword": {
                  		"type": "keyword"
            }
              }
    }
}
}
And now the same search that was used in the beginning returns the desired results:
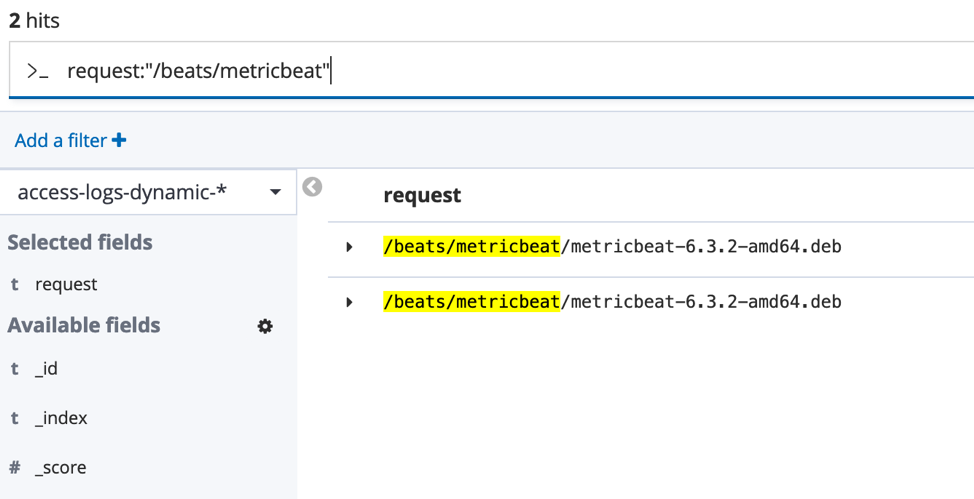
Note that it’s important to not apply the same tokenizer for the search value. Thus, the line "search_analyzer": "keyword" is present in the mapping. Otherwise the search term /beats/metricbeats would also be tokenized into /beats and /beats/metricbeats and /beats would match the term /beats of /beats/~/metricbeat/metricbeat-6.3.2-amd64.deb.
Preprocess values to make them usable
Sometimes a custom analyzer is not a good option to process the data. It might just not be at all possible, too complicated, or too slow.
One example is that we want to filter out requests coming from a certain user agent e.g. from all iPhones. As you can see in the image below, there are quite a lot of different values and filtering them all out is very cumbersome.

If that’s all you want to do, you will probably manage to manually select all those matching user agent strings. However, if you wanted to find out how many requests come from which browser by creating a chart like the one shown below, that is not possible.
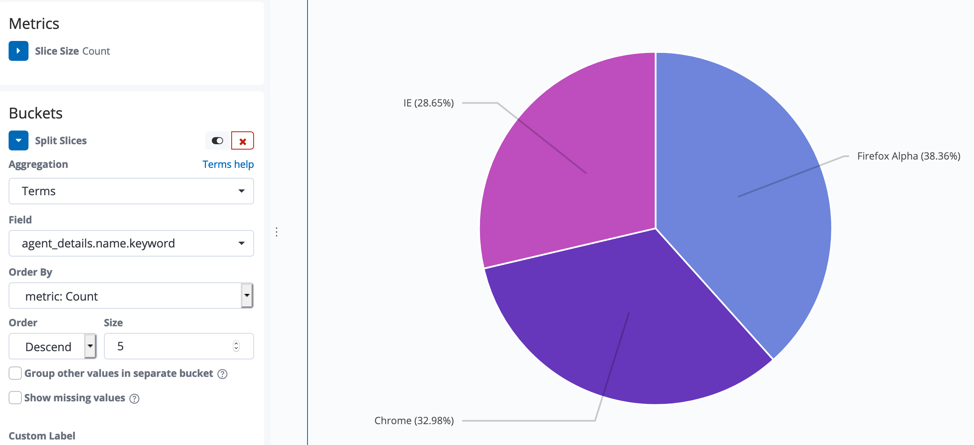
Thus, it’s a good idea to parse the user agent string beforehand. I will show you how to do it with logstash, but there is also an ingest node processor for Elasticsearch and a plugin for fluentd.
In logstash you define where the data is coming from (input) and where it should be stored (output). In between you can perform arbitrary operations on the data using filters. One of those filters is the useragent filter. It parses the user agent value and stores the result into new fields.
By specifying the following filter
filter {
useragent {
    source => "agent"
    target => "agent_details"
}
}
the user agent stored in the field agent
Mozilla/5.0 (X11; Linux i686) AppleWebKit/534.24 (KHTML, like Gecko) Chrome/11.0.696.50 Safari/534.24
will be parsed and the resulting values will be stored in the new field agent_details:
 "agent_details": {
  	"device": "Other",
  	"minor": "0",
  	"os_name": "Linux",
  	"name": "Chrome",
  	"major": "11",
  	"os": "Linux",
  	"patch": "696",
  	"build": ""
}
The single values such as agent_details.name can now be used for filtering or aggregations, allowing a visualization as shown above to be created.
Preprocess values to speed up search
Another use case for preprocessing data is to speed up search. All desired results can possibly be extracted from the data, but it just takes a very, very long time. Let’s have a look at the following URLs
https://www.example.com/?utm_source=google&utm_medium=cpc&utm_campaign=c3
https://www.example.com/?utm_source=google&utm_medium=cpc&utm_campaign=c4
https://www.example.com/?utm_source=newsletter1&utm_medium=cpc&utm_campaign=c4
https://www.example.com/?utm_source=newsletter2&utm_medium=cpc&utm_campaign=c4
We want to search for only those entries where the query parameter utm_campaign equals c4and where utm_source is not google.
Using url:"utm_campaign=c4" -url:"utm-source=google" leads to the desired entries:
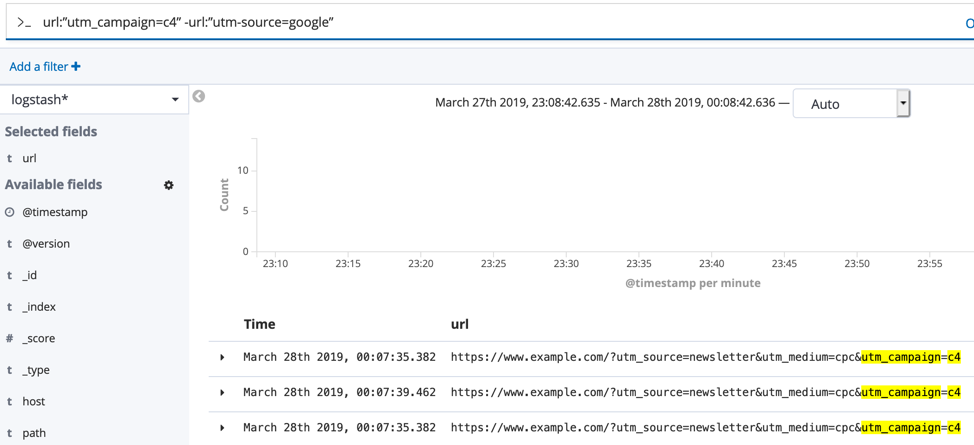
But such a full-text search can take quite a while if there are a lot of log entries. In the worst case, it will take so long that the query times out and no results are returned at all.
A better approach is to split the query string and store each parameter separately. For this you can use another logstash filter plugin, the Kv filter plugin. It will parse the query string and create a new field for each query parameter[^1].
The following filter will parse the value from the url field and store all query parameters in the new query field.
filter {
  kv {
		source => "url"
	    target => "query"
		field_split => "&?"
  	}
}
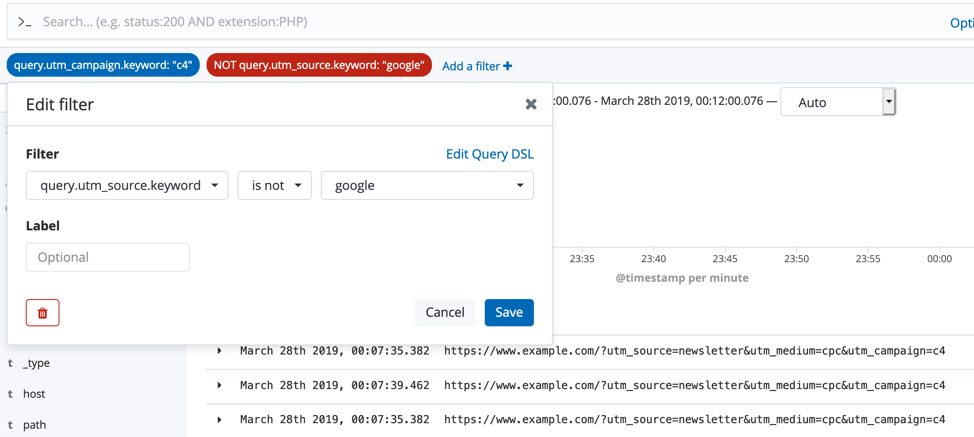
You can now select all query parameters for filtering
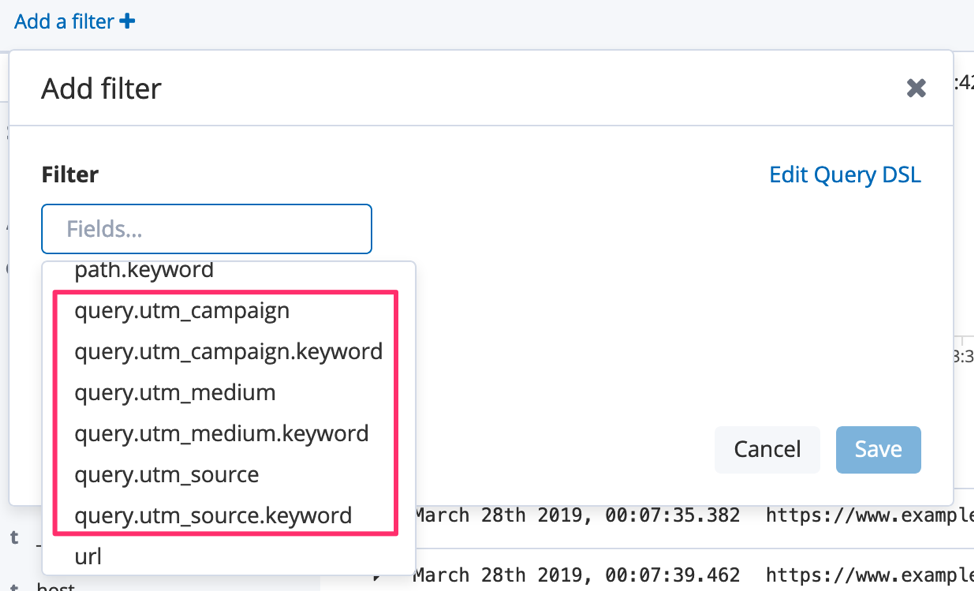
and your search will become easier and faster.
Now what?
So, should you now go ahead and add custom analyzers to all your fields and preprocess data wherever possible? Definitely not.
Keep in mind that custom analyzers are defined in the index mapping. Changing them requires reindexing all data. You also have to test that they work as expected (functionally, but also in regard to performance). An additional drawback is that there is no UI that guides your Kibana users in any way. The analyzers either must be really intuitive so that the users won’t notice that they even exist and are just amazed by the good and fast results. Or you have to make the analyzers known to the users so that they can take full advantage of them.
The last point does not apply to pre-processors. Since new fields are added directly to the document, those fields are shown in Kibana like any other field and are easily available for users to search on. The main disadvantage of pre-processors is that your setup becomes more complex. If your logstash filter is broken, you might lose logs. And if you add too many steps, the ingestion pipeline might start to slow down and it takes longer for logs to show up in Kibana.
Still, I usually prefer pre-processing over a custom analyzer. Failure and performance can be monitored and improved in a standard way and once the data is indexed in Elasticsearch, it’s like any other field. The only time I would choose a custom analyzer is when pre-processing is not an option, e.g. in case of the request field above.
Conclusion
This blog post was the last one in the series on how to make working with your logs easier and better. To summarize all the tips & tricks:
- Think beforehand about how your data is structured and what you want to do with your data.
- Define the mapping accordingly. Add all known fields with the correct type(s) and consider using custom analyzers to improve usability and performance.
- If certain searches cannot be performed because the raw data doesn’t allow it, pre-process the data, e.g. with logstash.
- Implement a strategy for dealing with unknown fields that will reduce the risk of log entries being rejected.
Let us know if any of these tips helped you improve your experience or if we can support you in any way in getting more out of your logging stack. Feel free to contact us via mail info@kreuzwerker.de
Credits for cover image go to: Unsplash

