

Let’s imagine a recently founded startup that’s growing successfully. But some questions have come up that you have a hard time finding the answer to in your data; such as “What are the margins of our products after returns and taking vouchers into account?” or “What influences the fulfillment rate of customer orders in our marketplace?” This might be because your data is messy or the data is all over the place and not integrated with each other. Or maybe someone has to manually repeat this time-consuming and error-prone analysis every other week because you have no way to automate it. If this or some other challenges sound dreadfully familiar to you, and you have just started putting together your data team, then this article is for you!
In this article I describe a Data Warehouse (DWH) tech stack, which will enable your startup to make data-driven decisions, allow the data team to iterate fast and without unnecessarily straining any engineering resources and still be reasonably futureproof.
General Recommendations
The following are the general thoughts behind the recommended stack:
- Concentrate on what brings value. The most important task in this situation is putting business relevant datasets and dashboards out where they are actually used. Trying to figure out how to get data out of source services or building your own data orchestrator is not adding value at this point. Such services can be outsourced instead of building them yourself. These services will cost money, but they also free your hard-to-get data/analytics engineers for more valuable and interesting tasks.
- Use simple and proven tech: Complexity drives engineering needs and engineering resources are probably the scarcest resource you have. So think hard if you really need real time data or if hourly or even daily batches are enough to support your use case. Also, if you want the non-engineer people of the data team to contribute to the DWH development, the tech stack (e.g. for personal dev setups) needs to reflect this, too.
- Use SQL: SQL is the lingua franca for data analytics. Having a SQL interface will enable more people to run their special analyses themselves instead of waiting for the data team to build something for them. So whatever DWH tech you settle on, it needs to support SQL.
With this in mind, this is my recommendation for a tech stack and what to look out for:
The Stack
The following diagram shows the basic stack: data ingestions via a service, doing all the transformations in the DWH database (ELT instead of ETL) and then using that as a source of truth for any further data usage. If you want to have similar pictures, search the internet for “modern data stack”. E.g. incident.io shared the story of implementing such a stack with a team of one in about two weeks.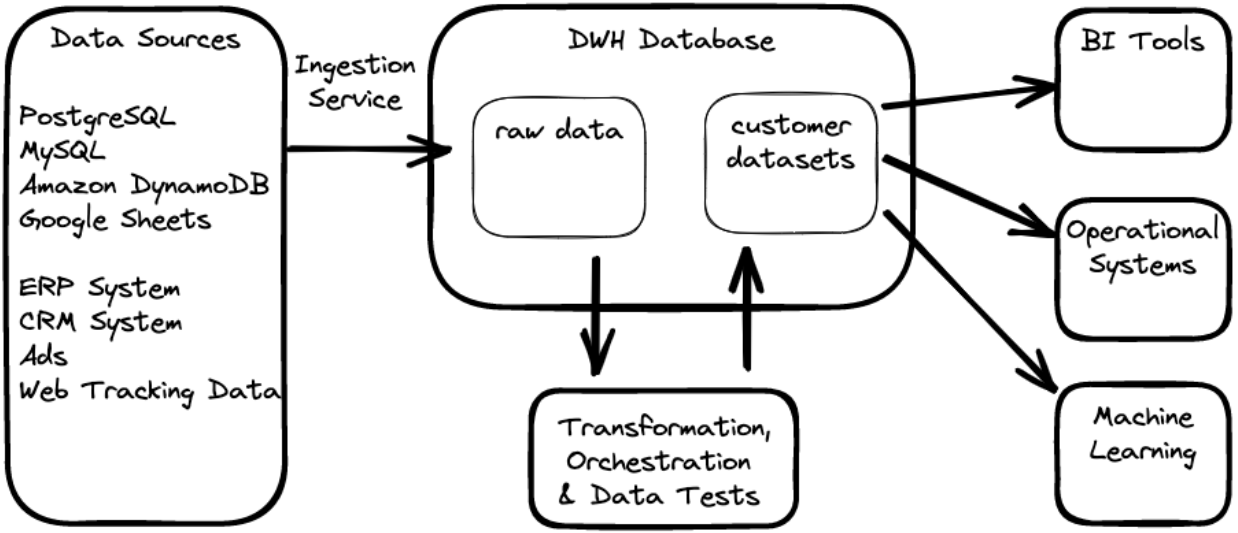
Data Loading via an Ingestion Service
It is usually easier to pay for managed ingestion services than setting up and maintaining such ingestion pipelines yourself, especially if you need help because your team simply does not have the required expertise. Available services include Fivetran, Stitch, and Airbyte. If using such a service becomes a cost issue, you can still switch to something custom built. But at that point you will probably already have a whole team of data engineers.
Apart from gaining access to all the features already built into the service without building these features yourself, there are many advantages to using a managed service. You will not get surprised by changing upstream APIs. There is no need to maintain your own infrastructure for it and these services have all the edge case handling figured out. They also partly shield you from changing APIs or changes in the database schemas (you still have to deal with that in your transformation, though).
Another benefit of using managed ingestion services is that they also make it easy to exclude Personal Identifiable Information (PII) data from reaching your DWH. This is sometimes the easiest way to make sure that this data will not leak to the wrong persons or even worse, the internet. Try to keep all PII data out of the DWH by default and only include it if needed (and secured!).
Data Warehouse DB
First priority: It needs to speak SQL. Second priority: You want a DWH DB that offers a separation of compute and storage, partly because of scaling later on, but at this stage more importantly for spinning up more compute power during Pipeline runs or for development sessions. The latter is a big driver of how fast your data team can implement new datasets and features: having realistic data and fast feedback on a change during development greatly speeds up development cycles.
The main DWH offerings that meet the above expectations are Snowflake, Google Bigquery, and Amazon Redshift. Featurewise, these three have similar functionalities but there are differences, e.g. how long it takes to spin up new compute resources or how much maintenance work they need. Costwise, it seems they end up with similar numbers on your bill, depending on which blog post you read.
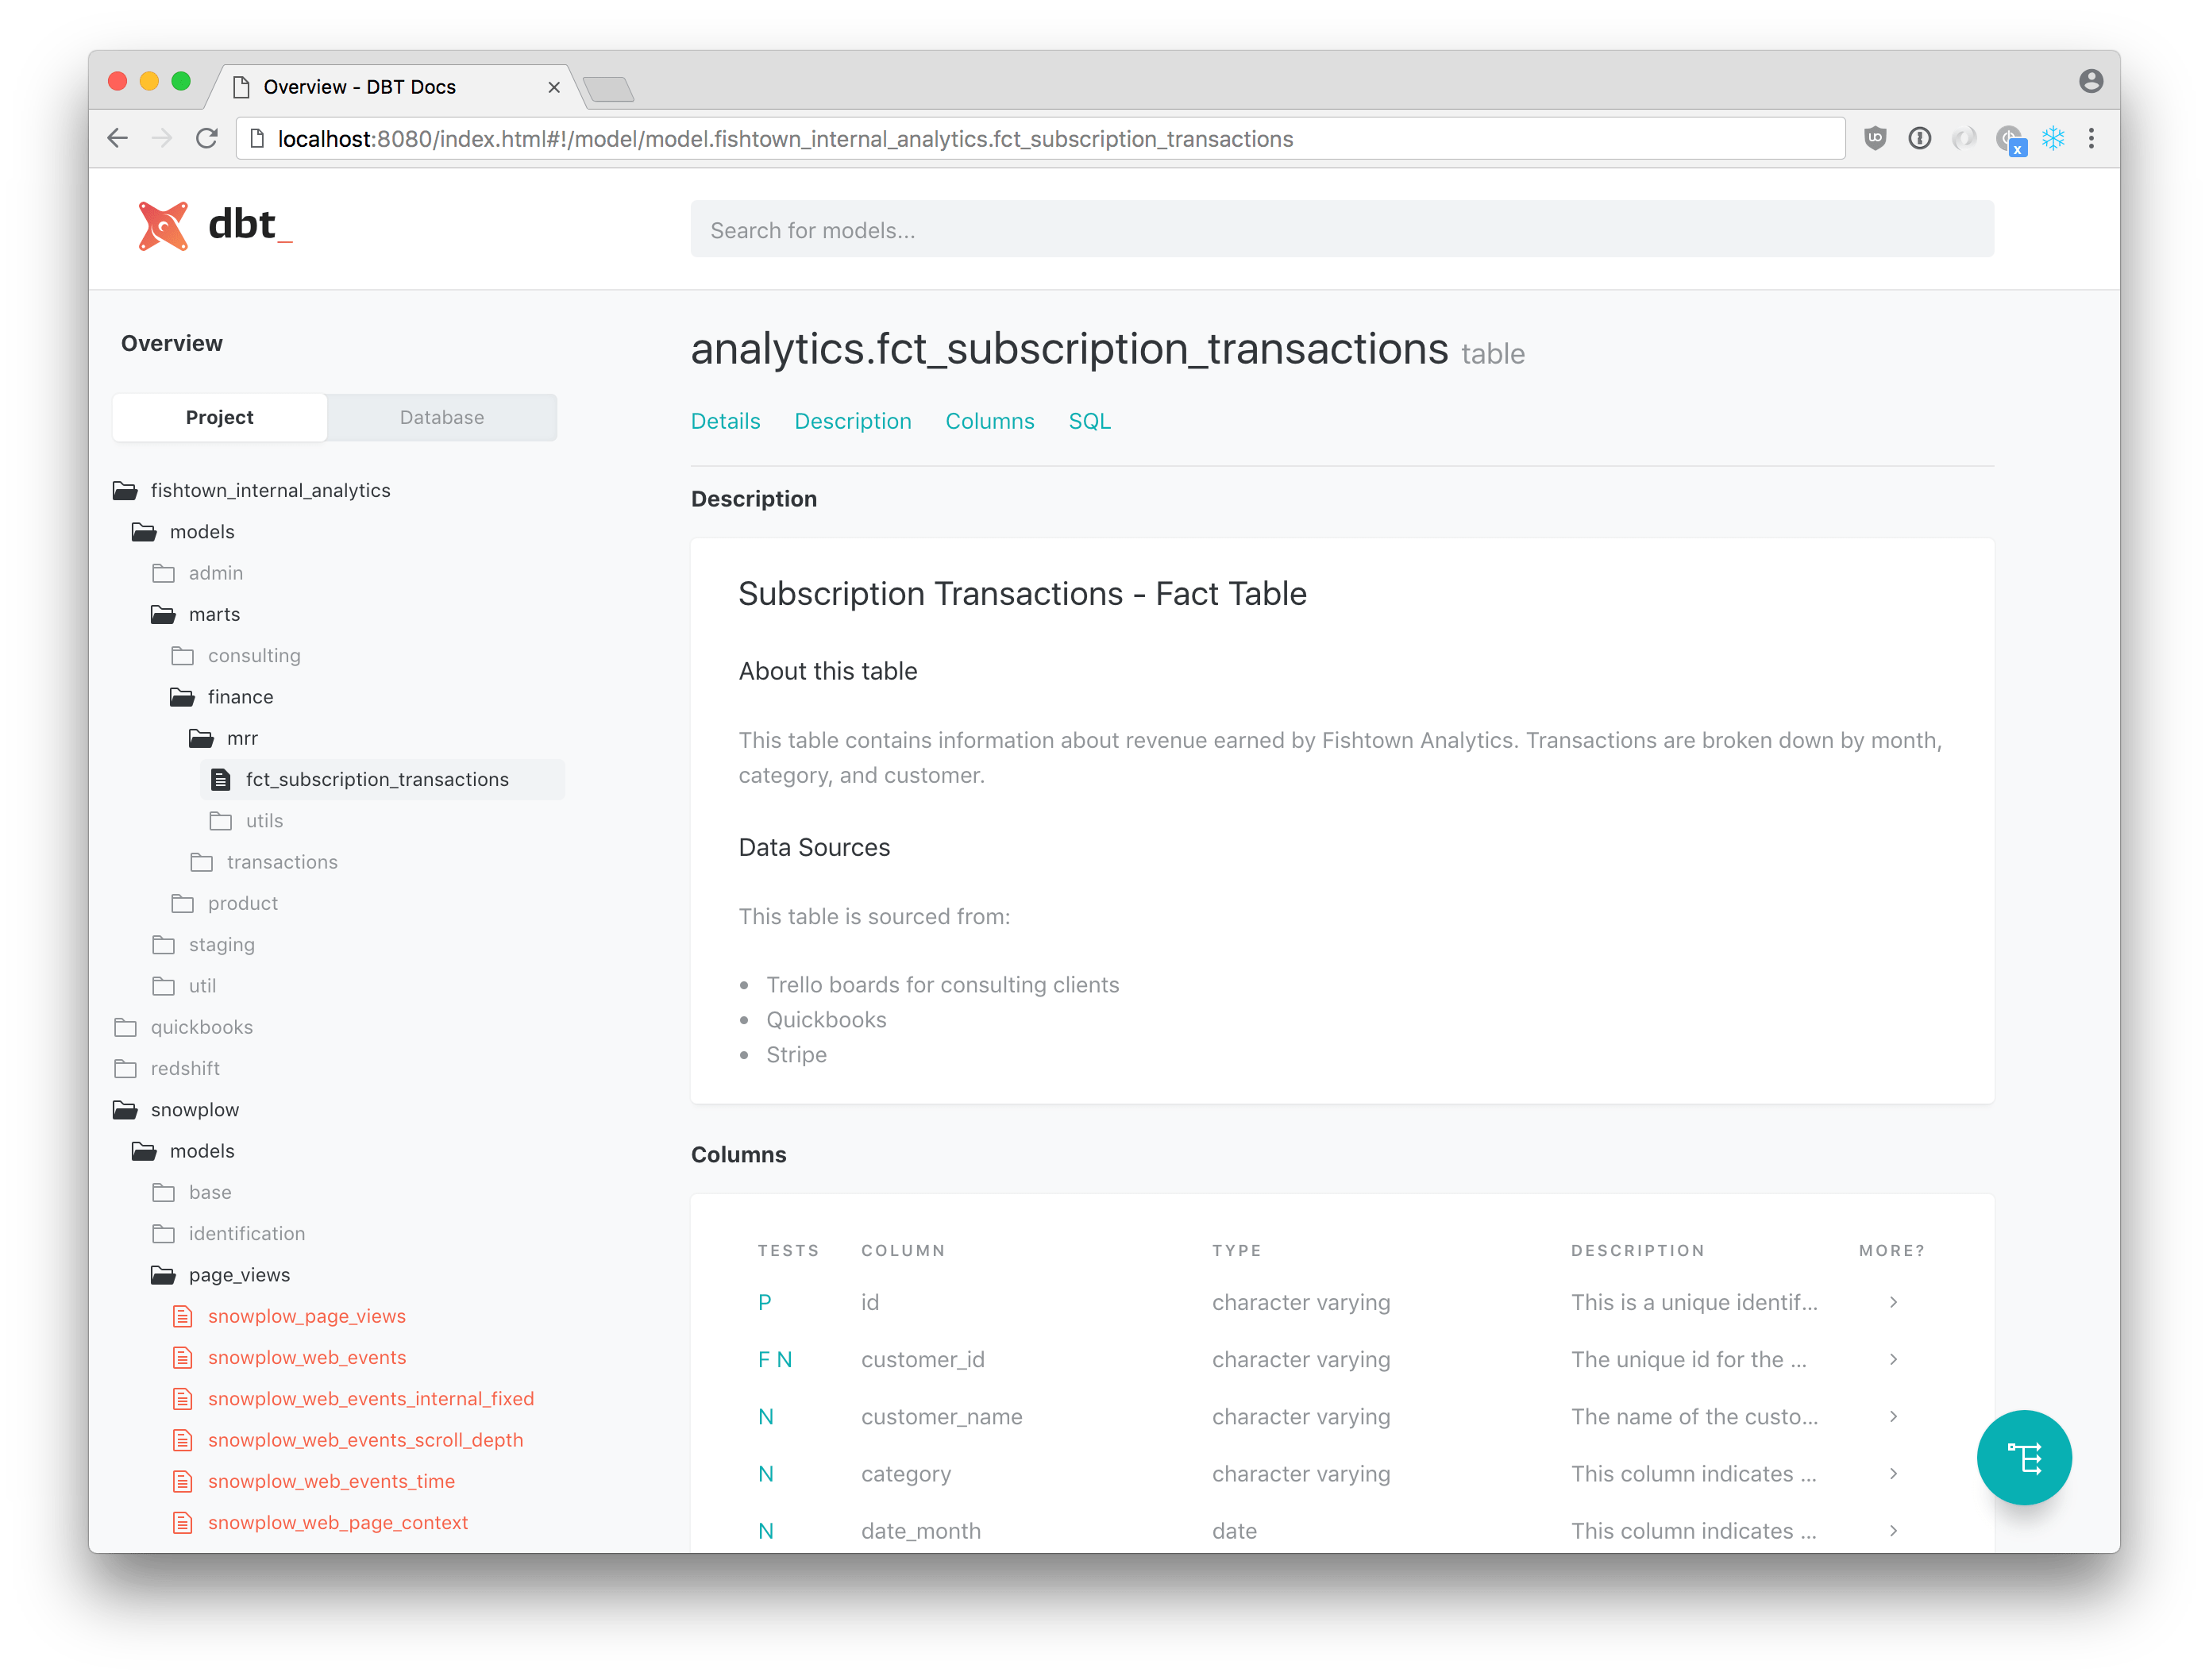
Transformation with dbt: building your source of truth
This is the part on which the rest of the stack depends. Here you have to apply domain knowledge to produce high quality datasets. As such, spending engineering ressources here makes the most sense.
The pipelines should be defined in code to be able to put them under version control and deploy them. This makes them easily reproducible and usable to spin up a dev environment.
dbt is the current de facto standard for data transformation. dbt has solid best practices, and a lot of nice features out of the box: from support for reusing code fragments via macros (e.g. only maintain a ignore-list in a single place, not all over) to data checks supporting data dictionaries and data lineage. It also has a vast ecosystem of add-on packages, apps, and integrations, if you need more. E.g. Fivetran makes generic dbt models available for some of their data sources. Or a code formatter for the monstrosity that is SQL+jinja 😃. There is also a very active community which is worth checking out!
Some additional things to look out for:
- Have concrete definitions for entities (customers, orders…), processes and the needed KPIs before you start writing code. Make sure these KPIs actually work with the available data. Sitting down with stakeholders and working this out takes a surprising amount of time! Putting some thoughts into this before writing code has two main benefits: a) it ensures that everyone is talking about the same thing and b) you do not get surprised by new or (worse) different requirements.
- Add tests: unit tests in SQL are still not really practical, but testing the data, before allowing users to see it, is possible. dbt has some basic tests like Non-NULL and so on. dbt_utils supports comparing data across tables. If you need more, there is Great Expectation and similar tools. dbt also supports writing SQL queries which output “bad” rows. Use this to, e.g. check a specific order against manually checked correct data. Tests give you confidence that your pipelines produce correct results: nothing is worse than waking up with a Slack message from your boss that the graphs look wrong… They are especially useful in case you have to refactor a data pipeline. Basically every query you would run during the QA phase of a change request has a high potential to become an automatic test.
- Automate deployments: make adding new shiny stuff as easy as possible. If possible by a single “merge” click on github. This allows even non-engineering team members to integrate their new features and not depend on engineers! This also enables everyone to fix a data pipeline in a hurry when this is needed (it will be).
- Have some code conventions: from trivial things such as how to format SQL or how to name a table to trickier stuff like how to model funnels or how to use dbt. The specifics usually do not really matter: just stick to some rules. Value is derived from the consistency (e.g. searching for something) and that you have put some thought (and common sense) into it. Make it as detailed as needed by your team. Just keep in mind: “Rules are there to make you think before you break them.”
- Try to support a separate dev environment (per developer, if possible) and automatically(!) keep the data in there as close to the production environment as possible. This ensures that you can support high development speed without breakage on your production data warehouse.
- Again: Make sure that you do not leak PII data to users that do not need this data. E.g. hash columns containing PII and only make the unhashed data available to specific users who need the data.
Scheduling / Orchestration of your pipelines
The features which are at this point relevant are a) schedule pipelines by trigger and time; b) get logs for runs for debugging purpose; c) get alerts if something goes wrong; and d) be able to manually trigger reruns if needed.
If you only need daily or hourly runs and if you schedule data imports elsewhere, you might get away with using an already existing automation server such as Jenkins and some cron expressions as a start. In fact, dbt offers a command line to run the pipelines and Jenkins gives you the UI for scheduling, logging and rerunning.
But if you have more sophisticated use cases, you usually end up with one of the following orchestration tools for your data pipelines: Airflow, Prefect, or Dagster. They all support the above list of features and much more. Airflow is the established tool, but it can be a beast to maintain, especially for personal dev environments. It might also be that other options fit your needs better. I recommend getting a hosted version instead of setting it up yourself: the time spent maintaining the tool might be better spent on maintaining and developing analytic pipelines. Or improving the developer experience for the team.
Using the data
Dashboarding and self service via BI Tools
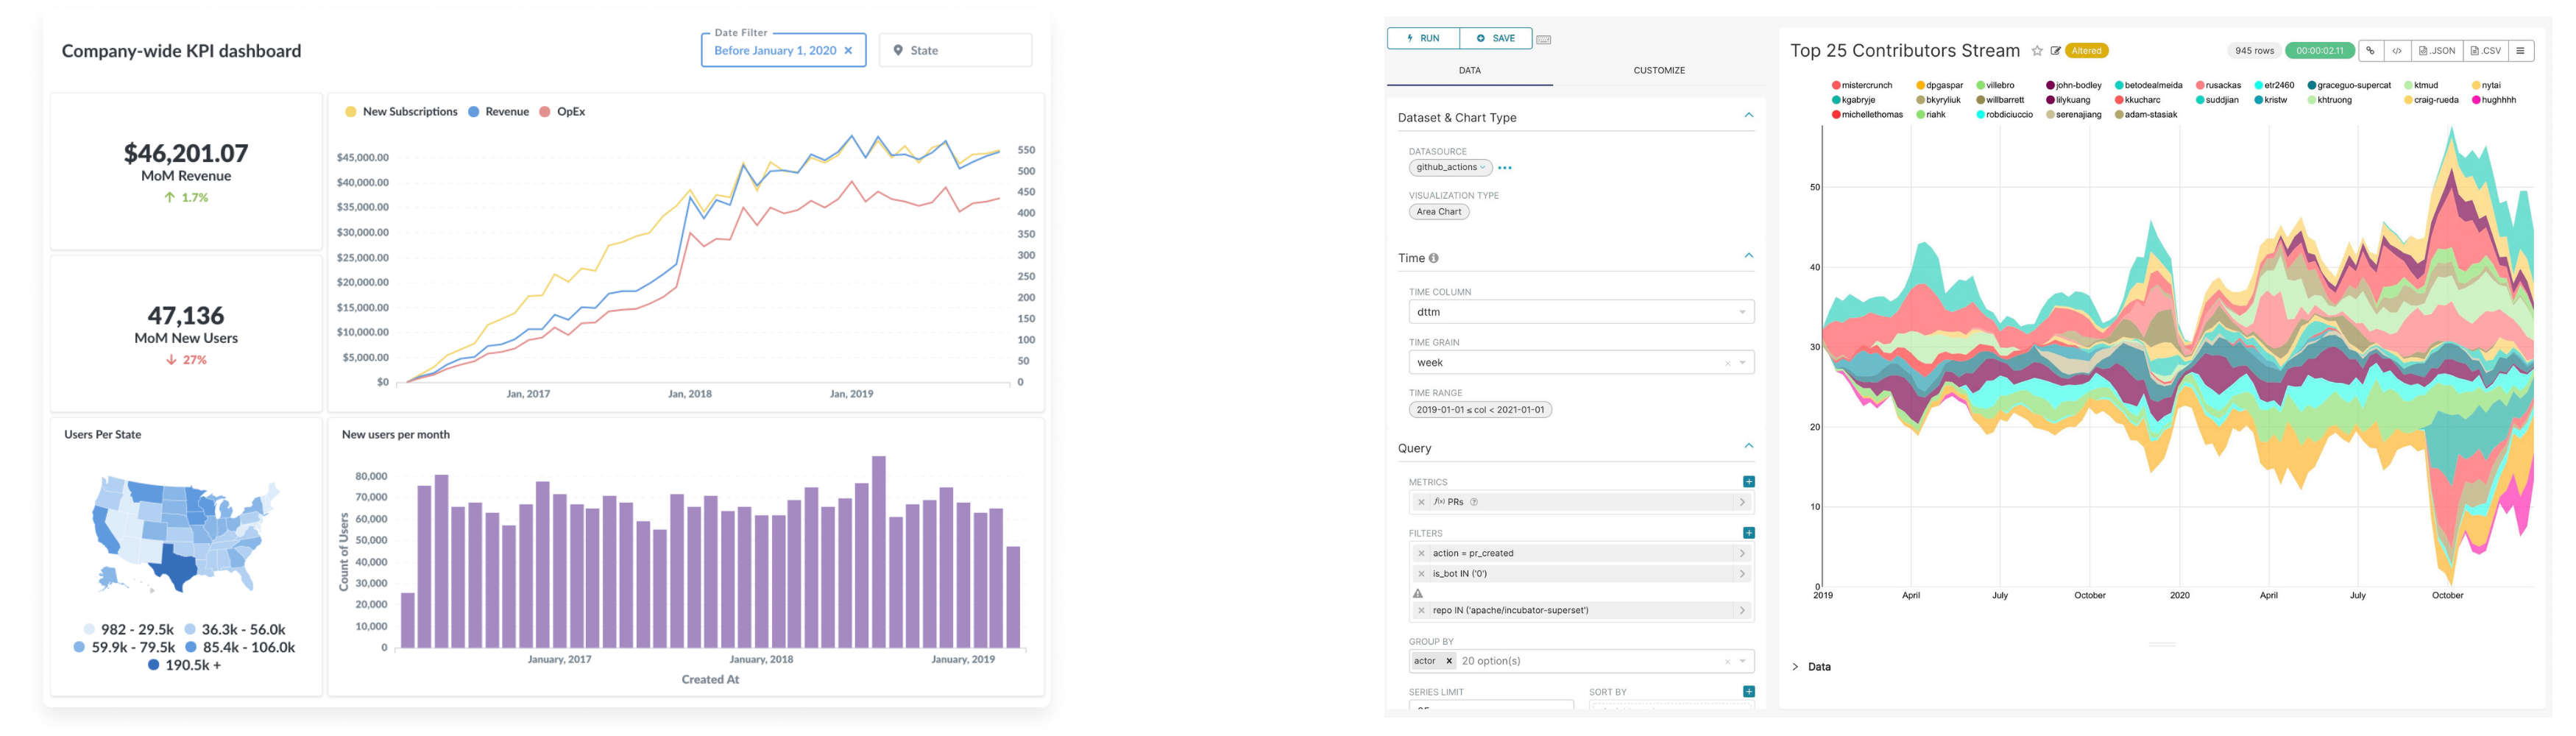
(Dashboards in Metabase and in Apache Superset)
Generate value by giving your users graphs, tables and dashboards, which they can use to figure out patterns in the data on which they can act upon. Options are Metabase, Apache Superset (both open source), or whatever BI Tool you like (and can afford the license cost for) such as Tableau, PowerBI, Looker, Sisense. Metabase and Apache Superset can be deployed in any environment which supports running docker containers and offers a (small) DB instance to persist the dashboards and configuration in. They probably cover most needs you have.
Most of the BI Tools offer a way to predefine and share KPIs and dimensions: this makes it easier to use the same correct definitions for common KPIs in the whole company as well as enable some basic self service tools. If you ever had to mediate between two different departments on when to count revenue as revenue, you might appreciate that a lot.[1]
Finally, if you have to offer some kind of interactive UI on top of some data or machine learning model, Streamlit or flask are good starting points.
Loading data into operational tools: “Reverse ETL”
Generate value by making data directly available in the operation apps of your business. A lot of operational tools allow you to upload datasets and enrich existing data which can then be used to improve processes. E.g. better audience selection in a CRM or newsletter system or workloads prioritization in an ERP system.
Same recommendation as the “Data Loading” section applies here: buy if you can. This is still a relatively new field, but there are already a few options: Hightouch, Census. If these services do not handle your case, the operational tools usually supply APIs to dump data into, but you have to write and maintain these scripts which use them.
Machine Learning
Machine learning has a lot of potential in the long run, but unless your business already depends on it, it should probably come later in the game[2]. Low hanging fruits offered by machine learning already at an early stage are predicting future revenue from your current revenue or customer churn prediction via xgboost. Don’t bother with any deep learning if you are on tabular data: xgboost beats it on almost all datasets.
The basic idea: prepare the input data for the model in the DB, use a Python script to load the data, then train the model, and finally predict the wanted data. Add the predicted data back into the DWH as a new table, which can be added to the dimensional model or uploaded to operational systems.
Don’t forget to measure model quality metrics and add monitoring on top of it: you want to get alerted in case data drift makes your models useless!
Conclusion
In this article, I described my recommended analytics stack for a startup that needs to gain insights from their data and professionalize this process. The stack should be relatively fast to implement (ideally, two weeks), so you can quickly reap the benefits of having a data warehouse and BI Tooling in place or upload enriched data back to operational systems.
Notes
It currently looks like this “metrics layer” part of the stack will get more attention, which I look forward to! ↩
and if your company depends on machine learning, you would probably not need this blog post. ↩